笔记
单击此处 下载完整的示例代码
mplot3d 工具包#
使用 mplot3d 工具包生成 3D 图。
本教程展示了各种 3D 绘图。单击图形以查看每个完整的图库示例以及生成图形的代码。
3D 轴(属于 类Axes3D)是通过将projection="3d"
关键字参数传递给 来创建的Figure.add_subplot:
import matplotlib.pyplot as plt
fig = plt.figure()
ax = fig.add_subplot(projection='3d')
与 2D 子图一样,可以在同一图形上添加多个 3D 子图。
在 1.0.0 版更改:在 Matplotlib 1.0.0 之前,Axes3D每个图只能创建一个;它需要直接实例化为.ax = Axes3D(fig)
在 3.2.0 版更改:在 Matplotlib 3.2.0 之前,必须显式导入
mpl_toolkits.mplot3d模块才能将“3d”投影到
Figure.add_subplot.
有关mplot3d 工具包的更多信息,请参阅mplot3d 常见问题解答。
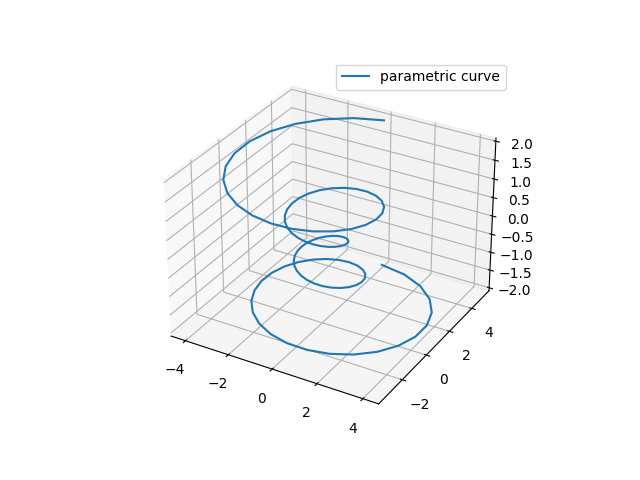
线图#
有关Axes3D.plotAPI 文档,请参阅。
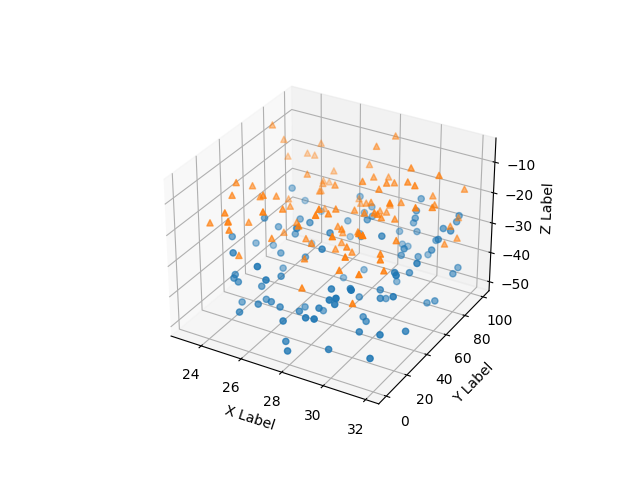
散点图#
有关Axes3D.scatterAPI 文档,请参阅。
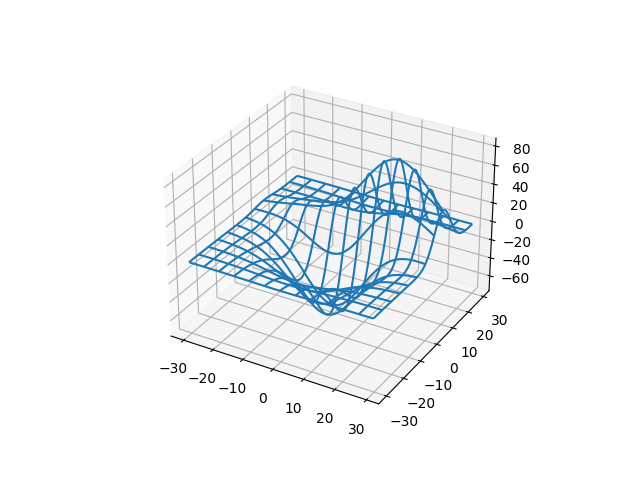
线框图#
有关Axes3D.plot_wireframeAPI 文档,请参阅。
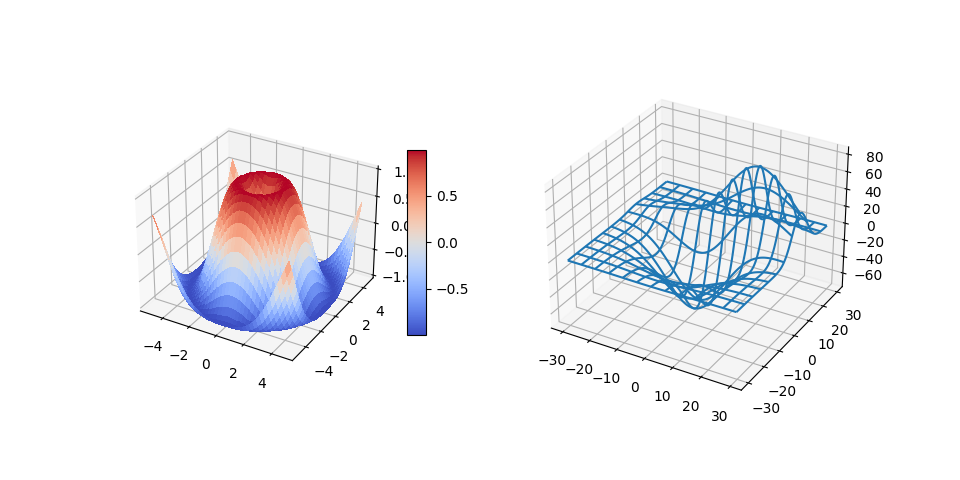
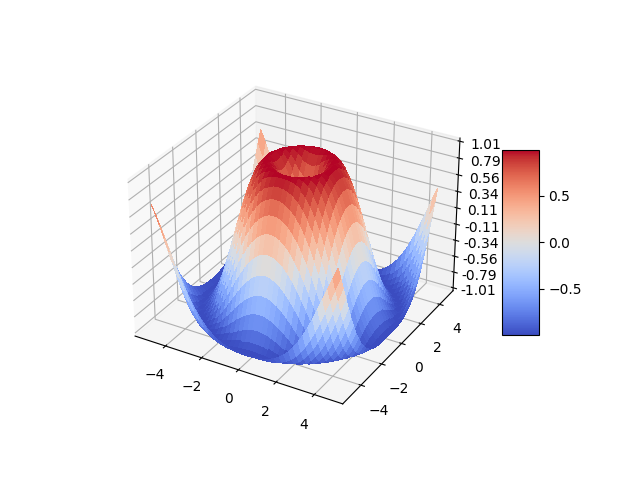
曲面图#
有关Axes3D.plot_surfaceAPI 文档,请参阅。
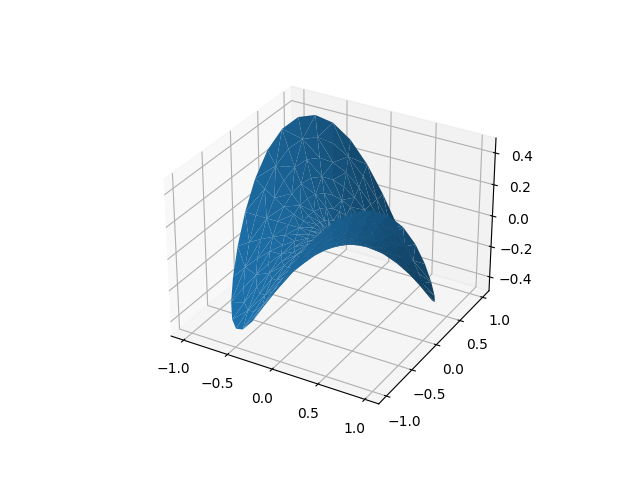
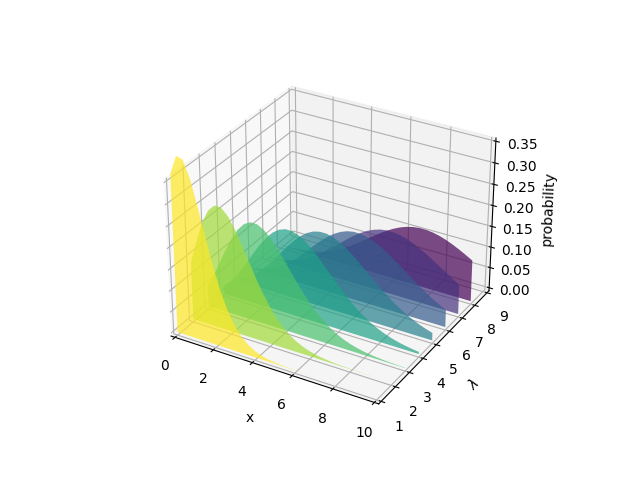
三曲面图#
有关Axes3D.plot_trisurfAPI 文档,请参阅。
等高线图#
有关Axes3D.contourAPI 文档,请参阅。
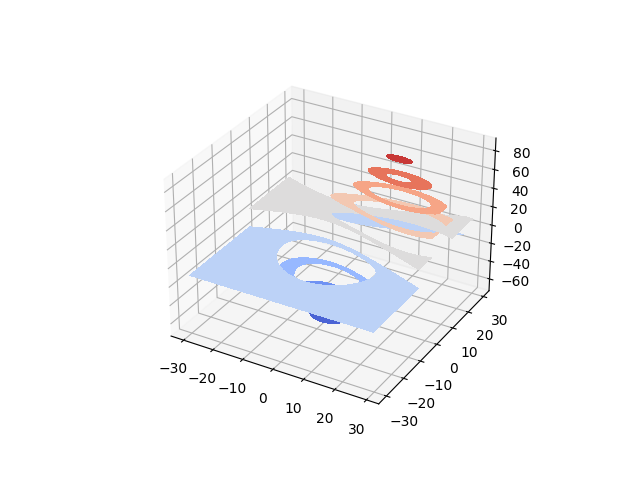
填充等高线图#
有关Axes3D.contourfAPI 文档,请参阅。
1.1.0 版中的新功能:由于 1.1.0 版的错误修复,启用了第二个 contourf3d 示例中演示的功能。
多边形图#
有关Axes3D.add_collection3dAPI 文档,请参阅。
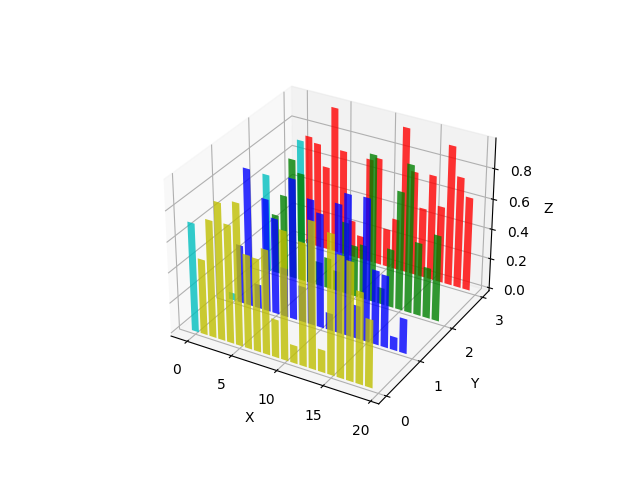
条形图#
有关Axes3D.barAPI 文档,请参阅。
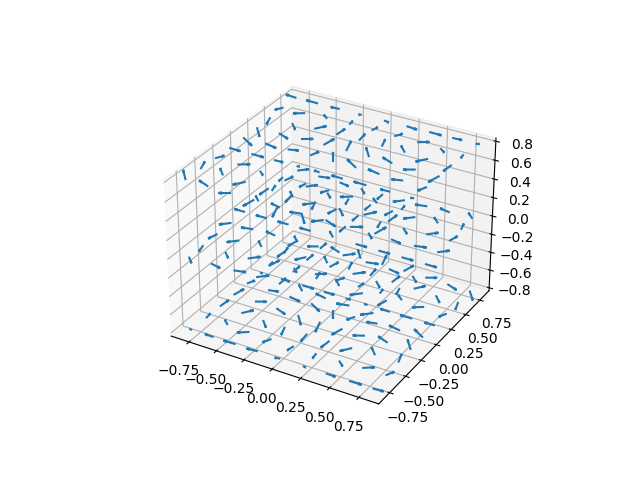
箭袋#
有关Axes3D.quiverAPI 文档,请参阅。
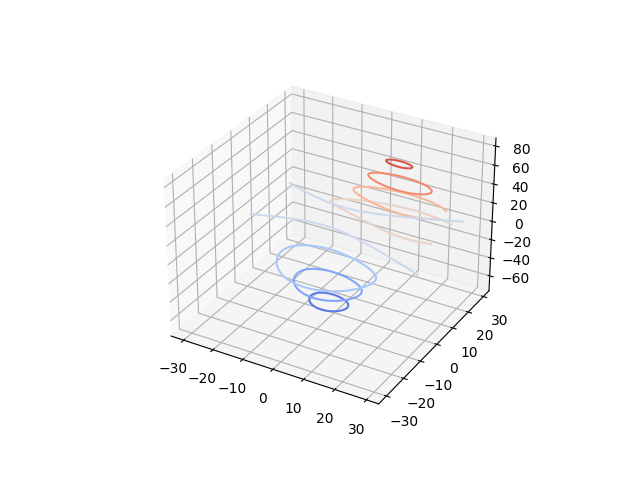
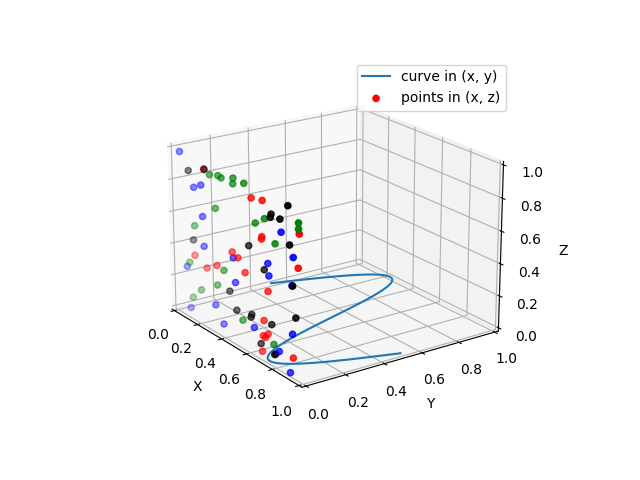
3D 中的 2D 绘图#
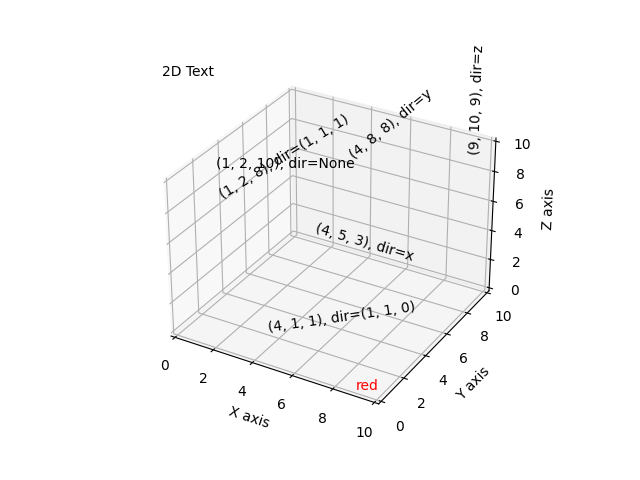
文字#
有关Axes3D.textAPI 文档,请参阅。