笔记
单击此处 下载完整的示例代码
命名颜色列表#
这会绘制 matplotlib 支持的命名颜色列表。有关 matplotlib 中颜色的更多信息,请参见
指定颜色教程;
matplotlib.colorsAPI ;颜色演示。
绘图辅助函数#
首先,我们定义了一个辅助函数来制作颜色表,然后我们将它用于一些常见的颜色类别。
from matplotlib.patches import Rectangle
import matplotlib.pyplot as plt
import matplotlib.colors as mcolors


def plot_colortable(colors, sort_colors=True, emptycols=0):

    cell_width = 212
    cell_height = 22
    swatch_width = 48
    margin = 12

    # Sort colors by hue, saturation, value and name.
    if sort_colors is True:
        by_hsv = sorted((tuple(mcolors.rgb_to_hsv(mcolors.to_rgb(color))),
                         name)
                        for name, color in colors.items())
        names = [name for hsv, name in by_hsv]
    else:
        names = list(colors)

    n = len(names)
    ncols = 4 - emptycols
    nrows = n // ncols + int(n % ncols > 0)

    width = cell_width * 4 + 2 * margin
    height = cell_height * nrows + 2 * margin
    dpi = 72

    fig, ax = plt.subplots(figsize=(width / dpi, height / dpi), dpi=dpi)
    fig.subplots_adjust(margin/width, margin/height,
                        (width-margin)/width, (height-margin)/height)
    ax.set_xlim(0, cell_width * 4)
    ax.set_ylim(cell_height * (nrows-0.5), -cell_height/2.)
    ax.yaxis.set_visible(False)
    ax.xaxis.set_visible(False)
    ax.set_axis_off()

    for i, name in enumerate(names):
        row = i % nrows
        col = i // nrows
        y = row * cell_height

        swatch_start_x = cell_width * col
        text_pos_x = cell_width * col + swatch_width + 7

        ax.text(text_pos_x, y, name, fontsize=14,
                horizontalalignment='left',
                verticalalignment='center')

        ax.add_patch(
            Rectangle(xy=(swatch_start_x, y-9), width=swatch_width,
                      height=18, facecolor=colors[name], edgecolor='0.7')
        )

    return fig
底色#
plot_colortable(mcolors.BASE_COLORS, sort_colors=False, emptycols=1)
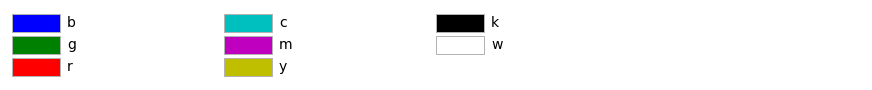
<Figure size 872x90 with 1 Axes>
画面调色板#
plot_colortable(mcolors.TABLEAU_COLORS, sort_colors=False, emptycols=2)

<Figure size 872x134 with 1 Axes>
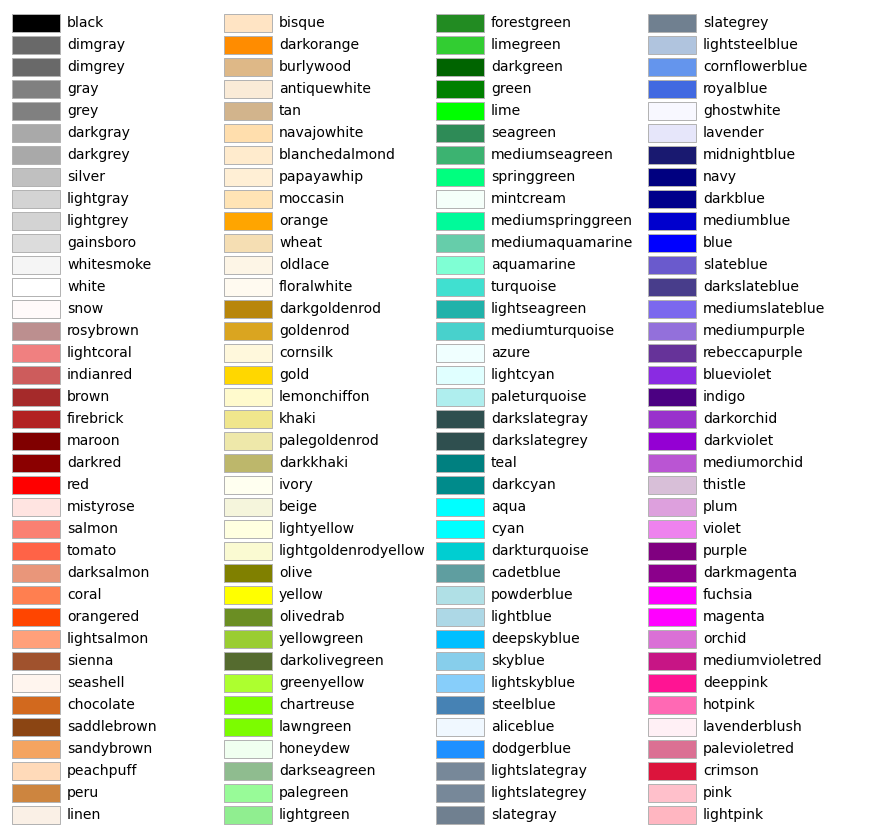
CSS 颜色#
plot_colortable(mcolors.CSS4_COLORS)
plt.show()
XKCD 颜色#
支持 XKCD 颜色,但它们会产生很大的图形,所以我们现在跳过它们。如果需要,您可以使用以下代码:
xkcd_fig = plot_colortable(mcolors.XKCD_COLORS, "XKCD Colors")
xkcd_fig.savefig("XKCD_Colors.png")
参考
此示例中显示了以下函数、方法、类和模块的使用:
脚本总运行时间:(0分1.530秒)