笔记
单击此处 下载完整的示例代码
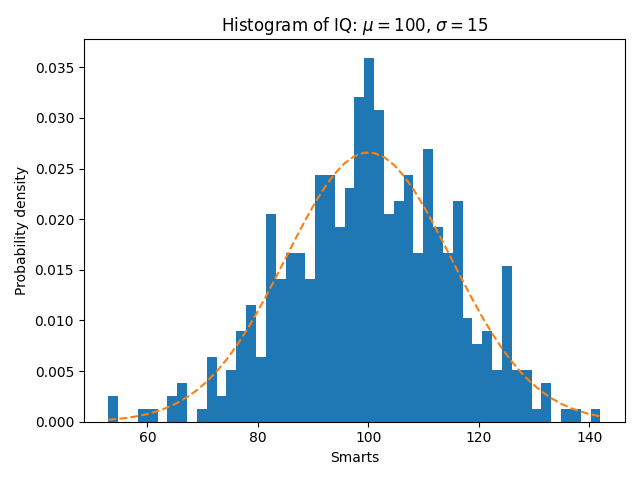
直方图(hist)函数的一些特点#
除了基本的直方图之外,此演示还显示了一些可选功能:
设置数据箱的数量。
密度参数,它对 bin 高度进行归一化,使直方图的积分为 1。生成的直方图是概率密度函数的近似值。
选择不同的 bin 计数和大小会显着影响直方图的形状。Astropy 文档中有一个很棒的部分介绍了如何选择这些参数。
import numpy as np
import matplotlib.pyplot as plt

np.random.seed(19680801)

# example data
mu = 100  # mean of distribution
sigma = 15  # standard deviation of distribution
x = mu + sigma * np.random.randn(437)

num_bins = 50

fig, ax = plt.subplots()

# the histogram of the data
n, bins, patches = ax.hist(x, num_bins, density=True)

# add a 'best fit' line
y = ((1 / (np.sqrt(2 * np.pi) * sigma)) *
     np.exp(-0.5 * (1 / sigma * (bins - mu))**2))
ax.plot(bins, y, '--')
ax.set_xlabel('Smarts')
ax.set_ylabel('Probability density')
ax.set_title(r'Histogram of IQ: $\mu=100$, $\sigma=15$')

# Tweak spacing to prevent clipping of ylabel
fig.tight_layout()
plt.show()
参考
此示例中显示了以下函数、方法、类和模块的使用: