笔记
单击此处 下载完整的示例代码
时间序列的自定义刻度格式化程序#
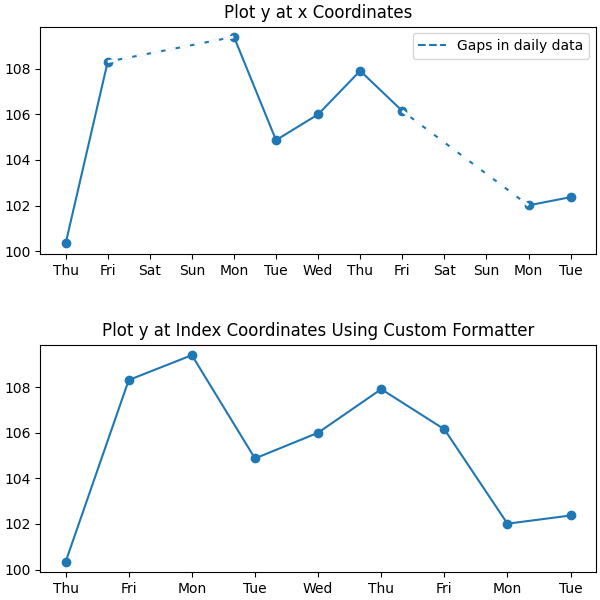
在绘制每日数据(例如金融时间序列)时,通常希望省略没有数据的日子(例如周末),以便以固定间隔绘制数据,而没有数据的日子没有多余的空格。该示例显示了如何使用“索引格式化程序”来实现所需的绘图。
import numpy as np
import matplotlib.pyplot as plt
import matplotlib.cbook as cbook
import matplotlib.lines as ml
from matplotlib.dates import DateFormatter, DayLocator
from matplotlib.ticker import Formatter


# Load a numpy record array from yahoo csv data with fields date, open, high,
# low, close, volume, adj_close from the mpl-data/sample_data directory. The
# record array stores the date as an np.datetime64 with a day unit ('D') in
# the date column (``r.date``).
r = (cbook.get_sample_data('goog.npz', np_load=True)['price_data']
     .view(np.recarray))
r = r[:9]  # get the first 9 days

fig, (ax1, ax2) = plt.subplots(nrows=2, figsize=(6, 6),
                               constrained_layout={'hspace': .15})

# First we'll do it the default way, with gaps on weekends
ax1.plot(r.date, r.adj_close, 'o-')

# Highlight gaps in daily data
gaps = np.flatnonzero(np.diff(r.date) > np.timedelta64(1, 'D'))
for gap in r[['date', 'adj_close']][np.stack((gaps, gaps + 1)).T]:
    ax1.plot(gap.date, gap.adj_close, 'w--', lw=2)
ax1.legend(handles=[ml.Line2D([], [], ls='--', label='Gaps in daily data')])

ax1.set_title("Plot y at x Coordinates")
ax1.xaxis.set_major_locator(DayLocator())
ax1.xaxis.set_major_formatter(DateFormatter('%a'))


# Next we'll write a custom index formatter. Below we will plot
# the data against an index that goes from 0, 1,  ... len(data).  Instead of
# formatting the tick marks as integers, we format as times.
def format_date(x, _):
    try:
        # convert datetime64 to datetime, and use datetime's strftime:
        return r.date[round(x)].item().strftime('%a')
    except IndexError:
        pass

# Create an index plot (x defaults to range(len(y)) if omitted)
ax2.plot(r.adj_close, 'o-')

ax2.set_title("Plot y at Index Coordinates Using Custom Formatter")
ax2.xaxis.set_major_formatter(format_date)  # internally creates FuncFormatter
除了将函数传递给Axis.set_major_formatter您,您还可以使用任何其他可调用对象,例如实现 __call__ 的类的实例:
class MyFormatter(Formatter):
    def __init__(self, dates, fmt='%a'):
        self.dates = dates
        self.fmt = fmt

    def __call__(self, x, pos=0):
        """Return the label for time x at position pos."""
        try:
            return self.dates[round(x)].item().strftime(self.fmt)
        except IndexError:
            pass


ax2.xaxis.set_major_formatter(MyFormatter(r.date, '%a'))