笔记
单击此处 下载完整的示例代码
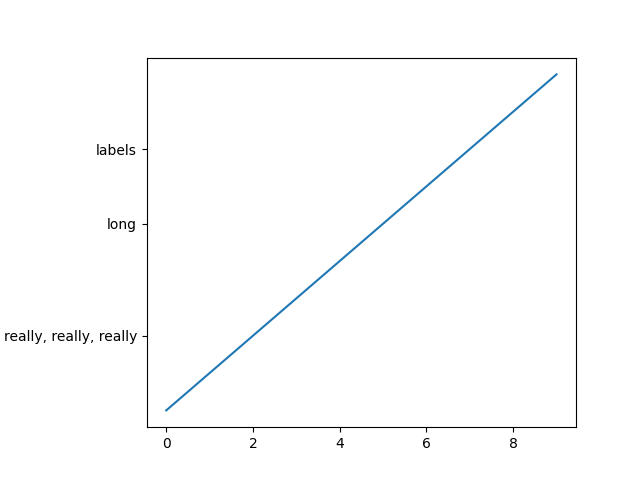
以编程方式控制子图调整#
笔记
这个例子主要是为了展示 Matplotlib 中的一些高级概念。
如果您只是在为标签寻找足够的空间,那么使用手动设置子图参数Figure.subplots_adjust或使用其中一种自动布局机制(约束布局指南或
紧密布局指南)几乎总是更简单且足够好。
此示例描述了一种用户定义的方式来读取艺术家尺寸并相应地设置子图参数。它的主要目的是说明一些高级概念,例如读取文本位置、使用边界框和变换以及使用 事件。但如果您想自动化布局并需要比紧凑布局和受限布局更大的灵活性,它也可以作为起点。
下面,我们收集所有 y 标签的边界框,并将子图的左边界向右移动,以便为所有边界框的并集留出足够的空间。
计算文本边界框有一个问题:查询文本边界框(Text.get_window_extent)需要一个渲染器(RendererBase实例)来计算文本大小。此渲染器仅在图形绘制后可用 ( Figure.draw)。
对此的解决方案是将调整逻辑放在绘制回调中。该函数在图形绘制完成后执行。它现在可以检查子图是否为文本留出足够的空间。如果不是,则更新子图参数并触发第二次绘制。
import matplotlib.pyplot as plt
import matplotlib.transforms as mtransforms

fig, ax = plt.subplots()
ax.plot(range(10))
ax.set_yticks([2, 5, 7], labels=['really, really, really', 'long', 'labels'])


def on_draw(event):
    bboxes = []
    for label in ax.get_yticklabels():
        # Bounding box in pixels
        bbox_px = label.get_window_extent()
        # Transform to relative figure coordinates. This is the inverse of
        # transFigure.
        bbox_fig = bbox_px.transformed(fig.transFigure.inverted())
        bboxes.append(bbox_fig)
    # the bbox that bounds all the bboxes, again in relative figure coords
    bbox = mtransforms.Bbox.union(bboxes)
    if fig.subplotpars.left < bbox.width:
        # Move the subplot left edge more to the right
        fig.subplots_adjust(left=1.1*bbox.width)  # pad a little
        fig.canvas.draw()


fig.canvas.mpl_connect('draw_event', on_draw)

plt.show()
参考
此示例中显示了以下函数、方法、类和模块的使用: