笔记
单击此处 下载完整的示例代码
编写自定义图例#
逐个编写自定义图例。
有时您不想要一个与您绘制的数据明确关联的图例。例如,假设您绘制了 10 条线,但不希望每条都显示一个图例项。如果您只是绘制线条并调用ax.legend(),您将获得以下信息:
import matplotlib as mpl
from matplotlib import cycler
import matplotlib.pyplot as plt
import numpy as np

# Fixing random state for reproducibility
np.random.seed(19680801)

N = 10
data = (np.geomspace(1, 10, 100) + np.random.randn(N, 100)).T
cmap = plt.cm.coolwarm
mpl.rcParams['axes.prop_cycle'] = cycler(color=cmap(np.linspace(0, 1, N)))

fig, ax = plt.subplots()
lines = ax.plot(data)
ax.legend()
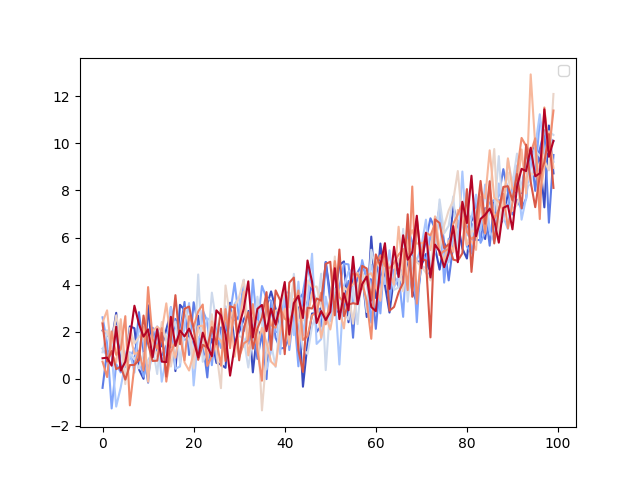
No artists with labels found to put in legend.  Note that artists whose label start with an underscore are ignored when legend() is called with no argument.

<matplotlib.legend.Legend object at 0x7f2cf9d80c40>
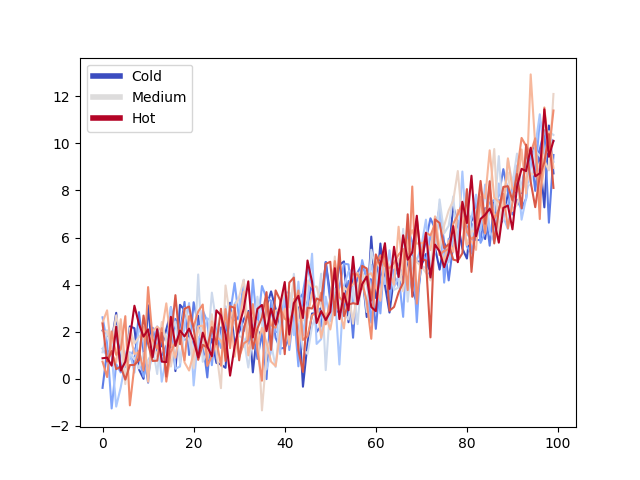
请注意,没有创建图例条目。在这种情况下,我们可以使用 Matplotlib 对象组成图例,这些对象未明确与绘制的数据相关联。例如:
from matplotlib.lines import Line2D
custom_lines = [Line2D([0], [0], color=cmap(0.), lw=4),
                Line2D([0], [0], color=cmap(.5), lw=4),
                Line2D([0], [0], color=cmap(1.), lw=4)]

fig, ax = plt.subplots()
lines = ax.plot(data)
ax.legend(custom_lines, ['Cold', 'Medium', 'Hot'])
<matplotlib.legend.Legend object at 0x7f2cfaadfac0>
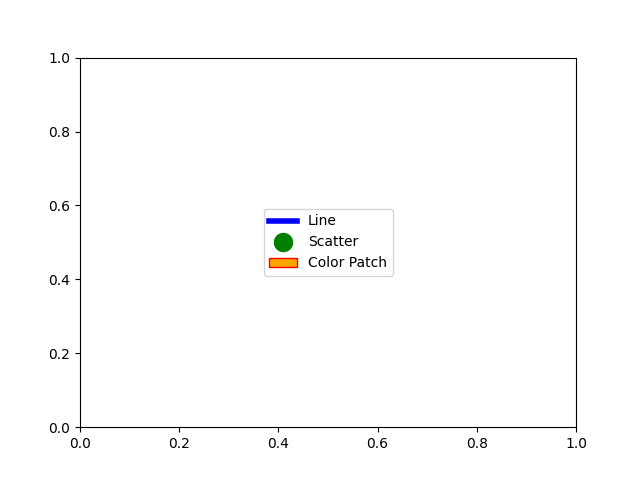
还有许多其他 Matplotlib 对象可以以这种方式使用。在下面的代码中,我们列出了一些常见的。
from matplotlib.patches import Patch
from matplotlib.lines import Line2D

legend_elements = [Line2D([0], [0], color='b', lw=4, label='Line'),
                   Line2D([0], [0], marker='o', color='w', label='Scatter',
                          markerfacecolor='g', markersize=15),
                   Patch(facecolor='orange', edgecolor='r',
                         label='Color Patch')]

# Create the figure
fig, ax = plt.subplots()
ax.legend(handles=legend_elements, loc='center')

plt.show()
脚本总运行时间:(0分1.610秒)