笔记
单击此处 下载完整的示例代码
轮廓标签演示#
说明一些可以用轮廓标签做的更高级的事情。
另请参阅轮廓演示示例。
import numpy as np
import matplotlib.ticker as ticker
import matplotlib.pyplot as plt
定义我们的表面
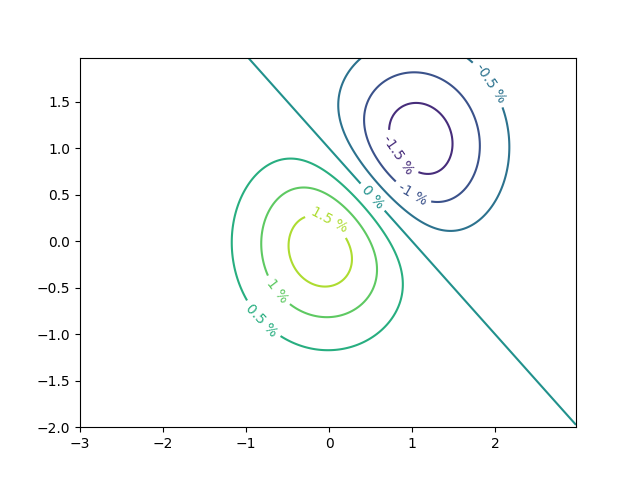
使用自定义级别格式化程序制作轮廓标签
# This custom formatter removes trailing zeros, e.g. "1.0" becomes "1", and
# then adds a percent sign.
def fmt(x):
    s = f"{x:.1f}"
    if s.endswith("0"):
        s = f"{x:.0f}"
    return rf"{s} \%" if plt.rcParams["text.usetex"] else f"{s} %"


# Basic contour plot
fig, ax = plt.subplots()
CS = ax.contour(X, Y, Z)

ax.clabel(CS, CS.levels, inline=True, fmt=fmt, fontsize=10)
<a list of 7 text.Text objects>
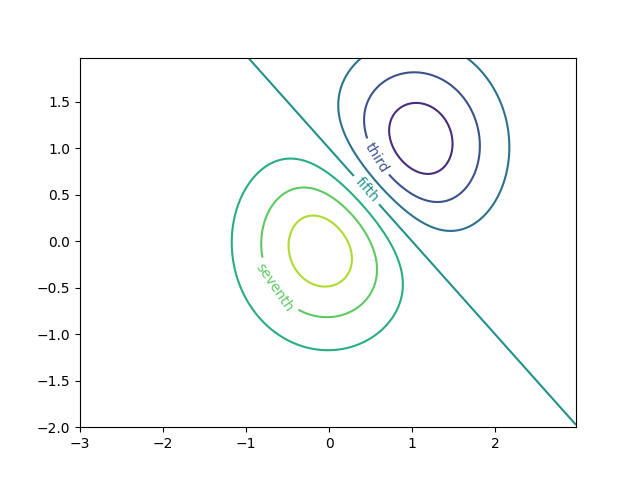
使用字典用任意字符串标记轮廓
fig1, ax1 = plt.subplots()

# Basic contour plot
CS1 = ax1.contour(X, Y, Z)

fmt = {}
strs = ['first', 'second', 'third', 'fourth', 'fifth', 'sixth', 'seventh']
for l, s in zip(CS1.levels, strs):
    fmt[l] = s

# Label every other level using strings
ax1.clabel(CS1, CS1.levels[::2], inline=True, fmt=fmt, fontsize=10)
<a list of 3 text.Text objects>
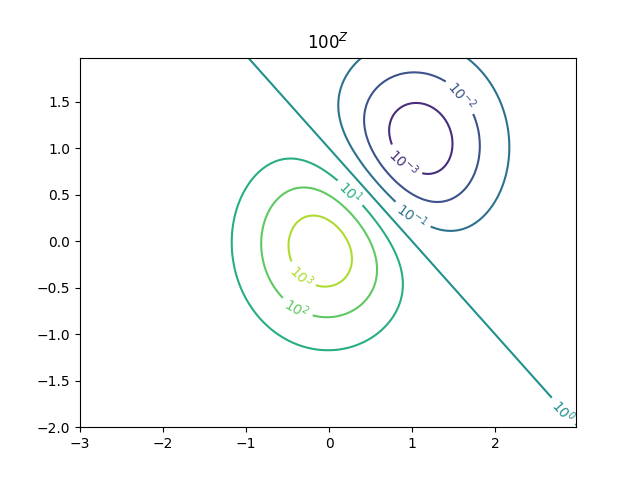
使用格式化程序
fig2, ax2 = plt.subplots()

CS2 = ax2.contour(X, Y, 100**Z, locator=plt.LogLocator())
fmt = ticker.LogFormatterMathtext()
fmt.create_dummy_axis()
ax2.clabel(CS2, CS2.levels, fmt=fmt)
ax2.set_title("$100^Z$")

plt.show()
参考
此示例中显示了以下函数、方法、类和模块的使用:
脚本总运行时间:(0分1.443秒)