笔记
单击此处 下载完整的示例代码
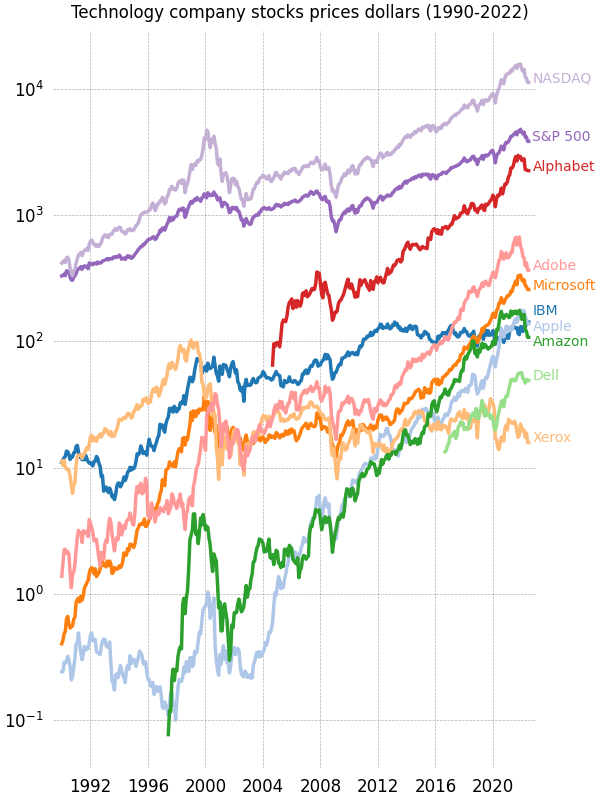
超过 32 年的股票价格#
多个时间序列图,展示了图框、刻度线、刻度标签和折线图属性的自定义样式。它还使用沿右边缘自定义放置文本标签作为传统图例的替代方案。
注意:第三方 mpl 风格的dufte可以用更少的代码生成外观相似的图。
import numpy as np
import matplotlib.transforms as mtransforms
import matplotlib.pyplot as plt
from matplotlib.cbook import get_sample_data


def convertdate(x):
    return np.datetime64(x, 'D')


fname = get_sample_data('Stocks.csv', asfileobj=False)
stock_data = np.genfromtxt(fname, encoding='utf-8', delimiter=',',
                           names=True, dtype=None, converters={0: convertdate},
                           skip_header=1)


fig, ax = plt.subplots(1, 1, figsize=(6, 8), layout='constrained')

# These are the colors that will be used in the plot
ax.set_prop_cycle(color=[
    '#1f77b4', '#aec7e8', '#ff7f0e', '#ffbb78', '#2ca02c', '#98df8a',
    '#d62728', '#ff9896', '#9467bd', '#c5b0d5', '#8c564b', '#c49c94',
    '#e377c2', '#f7b6d2', '#7f7f7f', '#c7c7c7', '#bcbd22', '#dbdb8d',
    '#17becf', '#9edae5'])

stocks_name = ['IBM', 'Apple', 'Microsoft', 'Xerox', 'Amazon', 'Dell',
               'Alphabet', 'Adobe', 'S&P 500', 'NASDAQ']
stocks_ticker = ['IBM', 'AAPL', 'MSFT', 'XRX', 'AMZN', 'DELL', 'GOOGL',
                 'ADBE', 'GSPC', 'IXIC']

# Manually adjust the label positions vertically (units are points = 1/72 inch)
y_offsets = {k: 0 for k in stocks_ticker}
y_offsets['IBM'] = 5
y_offsets['AAPL'] = -5
y_offsets['AMZN'] = -6

for nn, column in enumerate(stocks_ticker):
    # Plot each line separately with its own color.
    # don't include any data with NaN.
    good = np.nonzero(np.isfinite(stock_data[column]))
    line, = ax.plot(stock_data['Date'][good], stock_data[column][good], lw=2.5)

    # Add a text label to the right end of every line. Most of the code below
    # is adding specific offsets y position because some labels overlapped.
    y_pos = stock_data[column][-1]

    # Use an offset transform, in points, for any text that needs to be nudged
    # up or down.
    offset = y_offsets[column] / 72
    trans = mtransforms.ScaledTranslation(0, offset, fig.dpi_scale_trans)
    trans = ax.transData + trans

    # Again, make sure that all labels are large enough to be easily read
    # by the viewer.
    ax.text(np.datetime64('2022-10-01'), y_pos, stocks_name[nn],
            color=line.get_color(), transform=trans)

ax.set_xlim(np.datetime64('1989-06-01'), np.datetime64('2023-01-01'))

fig.suptitle("Technology company stocks prices dollars (1990-2022)",
             ha="center")

# Remove the plot frame lines. They are unnecessary here.
ax.spines[:].set_visible(False)

# Ensure that the axis ticks only show up on the bottom and left of the plot.
# Ticks on the right and top of the plot are generally unnecessary.
ax.xaxis.tick_bottom()
ax.yaxis.tick_left()
ax.set_yscale('log')

# Provide tick lines across the plot to help your viewers trace along
# the axis ticks. Make sure that the lines are light and small so they
# don't obscure the primary data lines.
ax.grid(True, 'major', 'both', ls='--', lw=.5, c='k', alpha=.3)

# Remove the tick marks; they are unnecessary with the tick lines we just
# plotted. Make sure your axis ticks are large enough to be easily read.
# You don't want your viewers squinting to read your plot.
ax.tick_params(axis='both', which='both', labelsize='large',
               bottom=False, top=False, labelbottom=True,
               left=False, right=False, labelleft=True)

# Finally, save the figure as a PNG.
# You can also save it as a PDF, JPEG, etc.
# Just change the file extension in this call.
# fig.savefig('stock-prices.png', bbox_inches='tight')
plt.show()
参考
此示例中显示了以下函数、方法、类和模块的使用:
脚本总运行时间:(0分1.548秒)