笔记
单击此处 下载完整的示例代码
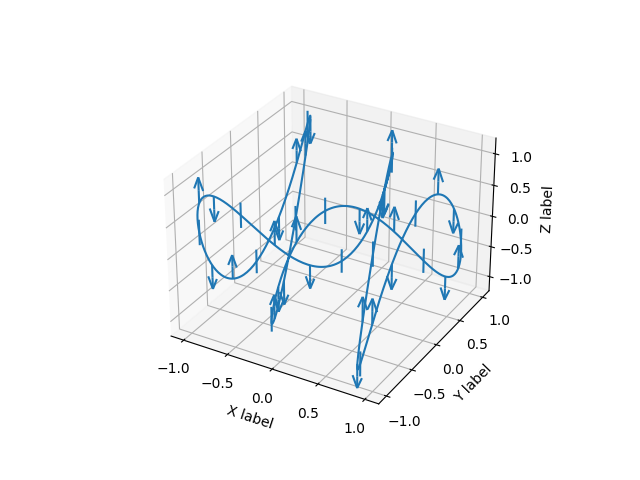
3D 误差线#
在 mplot3d 中使用具有上限和下限的误差线的示例。
import matplotlib.pyplot as plt
import numpy as np

ax = plt.figure().add_subplot(projection='3d')

# setting up a parametric curve
t = np.arange(0, 2*np.pi+.1, 0.01)
x, y, z = np.sin(t), np.cos(3*t), np.sin(5*t)

estep = 15
i = np.arange(t.size)
zuplims = (i % estep == 0) & (i // estep % 3 == 0)
zlolims = (i % estep == 0) & (i // estep % 3 == 2)

ax.errorbar(x, y, z, 0.2, zuplims=zuplims, zlolims=zlolims, errorevery=estep)

ax.set_xlabel("X label")
ax.set_ylabel("Y label")
ax.set_zlabel("Z label")

plt.show()