笔记
单击此处 下载完整的示例代码
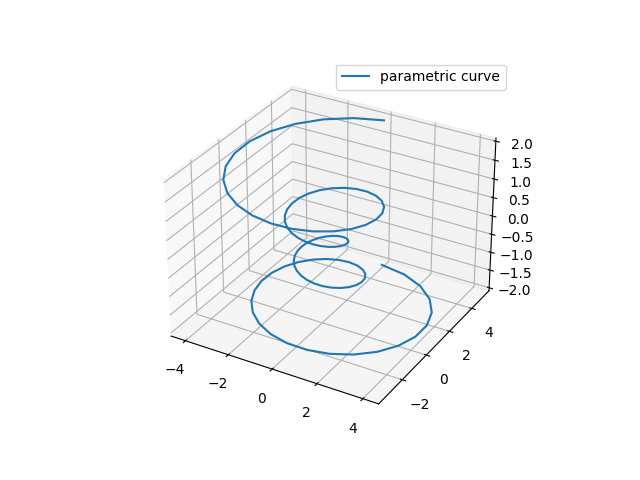
参数曲线#
此示例演示了在 3D 中绘制参数曲线。
import numpy as np
import matplotlib.pyplot as plt


ax = plt.figure().add_subplot(projection='3d')

# Prepare arrays x, y, z
theta = np.linspace(-4 * np.pi, 4 * np.pi, 100)
z = np.linspace(-2, 2, 100)
r = z**2 + 1
x = r * np.sin(theta)
y = r * np.cos(theta)

ax.plot(x, y, z, label='parametric curve')
ax.legend()

plt.show()