笔记
单击此处 下载完整的示例代码
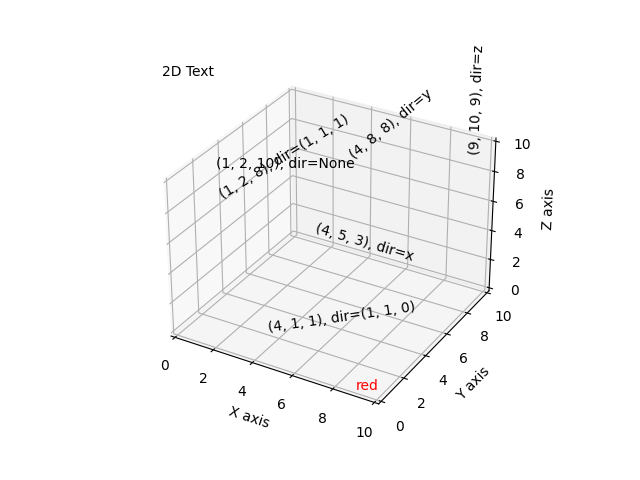
3D 文本注释#
演示在 3D 绘图上放置文本注释。
显示的功能:
使用具有三种“zdir”值的文本函数:无、轴名称(例如“x”)或方向元组(例如 (1, 1, 0))。
使用带有颜色关键字的文本函数。
使用 text2D 函数将文本放置在 ax 对象上的固定位置。
import matplotlib.pyplot as plt


ax = plt.figure().add_subplot(projection='3d')

# Demo 1: zdir
zdirs = (None, 'x', 'y', 'z', (1, 1, 0), (1, 1, 1))
xs = (1, 4, 4, 9, 4, 1)
ys = (2, 5, 8, 10, 1, 2)
zs = (10, 3, 8, 9, 1, 8)

for zdir, x, y, z in zip(zdirs, xs, ys, zs):
    label = '(%d, %d, %d), dir=%s' % (x, y, z, zdir)
    ax.text(x, y, z, label, zdir)

# Demo 2: color
ax.text(9, 0, 0, "red", color='red')

# Demo 3: text2D
# Placement 0, 0 would be the bottom left, 1, 1 would be the top right.
ax.text2D(0.05, 0.95, "2D Text", transform=ax.transAxes)

# Tweaking display region and labels
ax.set_xlim(0, 10)
ax.set_ylim(0, 10)
ax.set_zlim(0, 10)
ax.set_xlabel('X axis')
ax.set_ylabel('Y axis')
ax.set_zlabel('Z axis')

plt.show()