笔记
单击此处 下载完整的示例代码
填充Betweenx演示#
用于在两条fill_betweenx曲线之间沿水平方向着色。
import matplotlib.pyplot as plt
import numpy as np
y = np.arange(0.0, 2, 0.01)
x1 = np.sin(2 * np.pi * y)
x2 = 1.2 * np.sin(4 * np.pi * y)
fig, [ax1, ax2, ax3] = plt.subplots(1, 3, sharey=True, figsize=(6, 6))
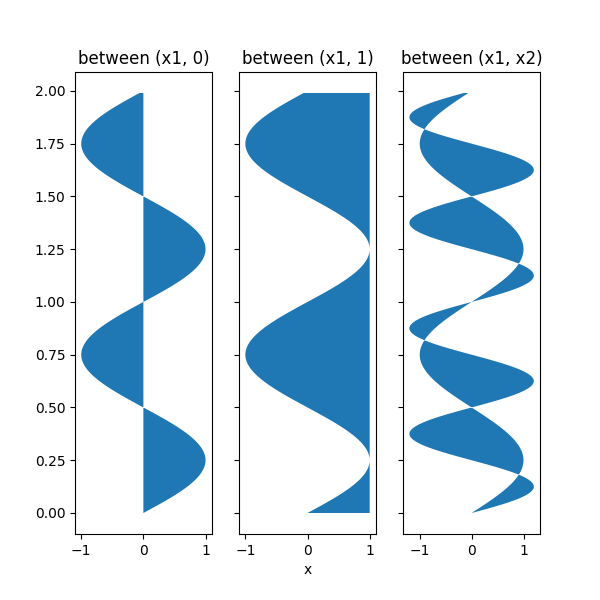
ax1.fill_betweenx(y, 0, x1)
ax1.set_title('between (x1, 0)')
ax2.fill_betweenx(y, x1, 1)
ax2.set_title('between (x1, 1)')
ax2.set_xlabel('x')
ax3.fill_betweenx(y, x1, x2)
ax3.set_title('between (x1, x2)')
Text(0.5, 1.0, 'between (x1, x2)')
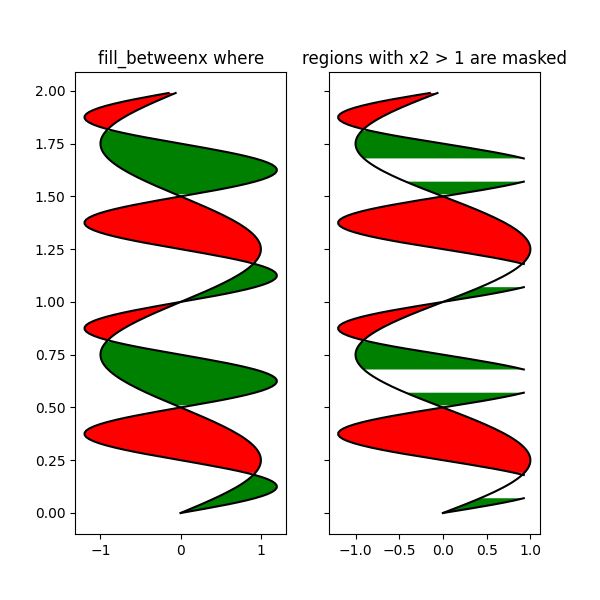
现在在满足逻辑条件的 x1 和 x2 之间填充。请注意,这与调用不同:
因为多个连续区域的边缘效应。
fig, [ax, ax1] = plt.subplots(1, 2, sharey=True, figsize=(6, 6))
ax.plot(x1, y, x2, y, color='black')
ax.fill_betweenx(y, x1, x2, where=x2 >= x1, facecolor='green')
ax.fill_betweenx(y, x1, x2, where=x2 <= x1, facecolor='red')
ax.set_title('fill_betweenx where')

# Test support for masked arrays.
x2 = np.ma.masked_greater(x2, 1.0)
ax1.plot(x1, y, x2, y, color='black')
ax1.fill_betweenx(y, x1, x2, where=x2 >= x1, facecolor='green')
ax1.fill_betweenx(y, x1, x2, where=x2 <= x1, facecolor='red')
ax1.set_title('regions with x2 > 1 are masked')
Text(0.5, 1.0, 'regions with x2 > 1 are masked')
这个例子说明了一个问题;由于数据网格化,交叉点处存在不需要的未填充三角形。一个蛮力解决方案是在绘图之前将所有数组插入到一个非常精细的网格中。
plt.show()
脚本总运行时间:(0分1.113秒)