笔记
单击此处 下载完整的示例代码
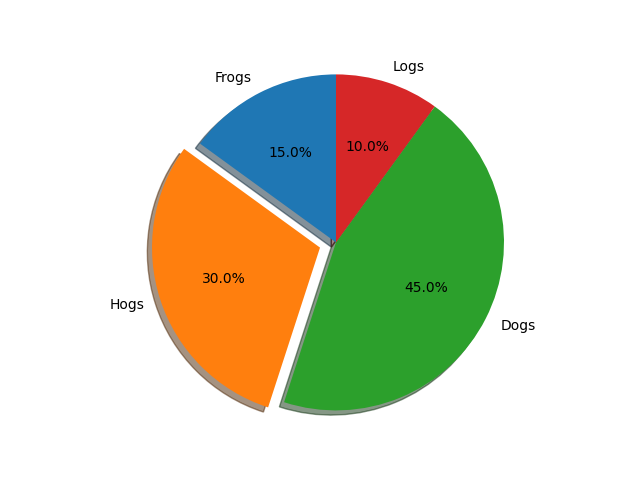
基本饼图#
基本饼图的演示以及一些附加功能。
除了基本的饼图之外,此演示还显示了一些可选功能:
切片标签
自动标记百分比
用“explode”偏移一个切片
投影
自定义起始角度
关于自定义起始角度的注意事项:
默认startangle值为 0,这将在正 x 轴上开始“青蛙”切片。此示例设置为使所有内容都逆时针旋转 90 度,并且青蛙切片从正 y 轴开始。startangle = 90
import matplotlib.pyplot as plt

# Pie chart, where the slices will be ordered and plotted counter-clockwise:
labels = 'Frogs', 'Hogs', 'Dogs', 'Logs'
sizes = [15, 30, 45, 10]
explode = (0, 0.1, 0, 0)  # only "explode" the 2nd slice (i.e. 'Hogs')

fig1, ax1 = plt.subplots()
ax1.pie(sizes, explode=explode, labels=labels, autopct='%1.1f%%',
        shadow=True, startangle=90)
ax1.axis('equal')  # Equal aspect ratio ensures that pie is drawn as a circle.

plt.show()