笔记
单击此处 下载完整的示例代码
使用 axes_grid 为 ylabel 腾出空间#
import matplotlib.pyplot as plt

from mpl_toolkits.axes_grid1 import make_axes_locatable
from mpl_toolkits.axes_grid1.axes_divider import make_axes_area_auto_adjustable


fig = plt.figure()
ax = fig.add_axes([0, 0, 1, 1])

ax.set_yticks([0.5], labels=["very long label"])

make_axes_area_auto_adjustable(ax)

fig = plt.figure()
ax1 = fig.add_axes([0, 0, 1, 0.5])
ax2 = fig.add_axes([0, 0.5, 1, 0.5])

ax1.set_yticks([0.5], labels=["very long label"])
ax1.set_ylabel("Y label")

ax2.set_title("Title")

make_axes_area_auto_adjustable(ax1, pad=0.1, use_axes=[ax1, ax2])
make_axes_area_auto_adjustable(ax2, pad=0.1, use_axes=[ax1, ax2])
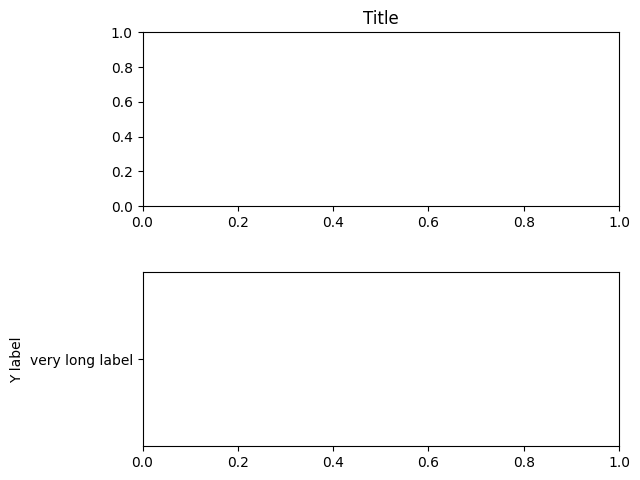
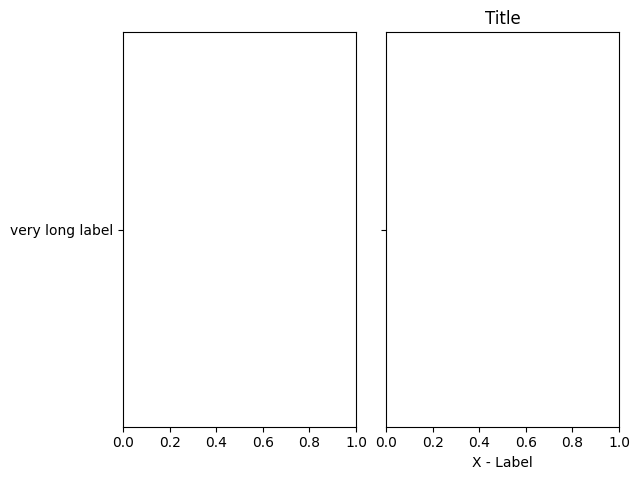
fig = plt.figure()
ax1 = fig.add_axes([0, 0, 1, 1])
divider = make_axes_locatable(ax1)

ax2 = divider.append_axes("right", "100%", pad=0.3, sharey=ax1)
ax2.tick_params(labelleft=False)
fig.add_axes(ax2)

divider.add_auto_adjustable_area(use_axes=[ax1], pad=0.1,
                                 adjust_dirs=["left"])
divider.add_auto_adjustable_area(use_axes=[ax2], pad=0.1,
                                 adjust_dirs=["right"])
divider.add_auto_adjustable_area(use_axes=[ax1, ax2], pad=0.1,
                                 adjust_dirs=["top", "bottom"])

ax1.set_yticks([0.5], labels=["very long label"])

ax2.set_title("Title")
ax2.set_xlabel("X - Label")

plt.show()
脚本总运行时间:(0分1.501秒)