笔记
单击此处 下载完整的示例代码
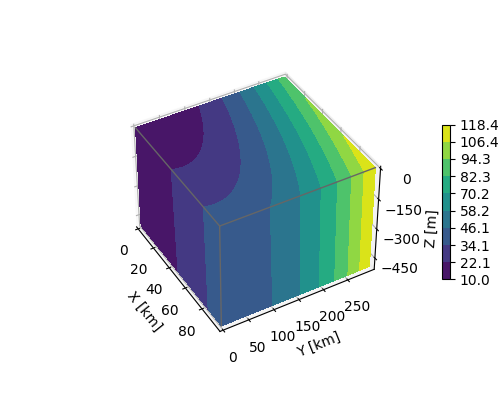
3D 箱形曲面图#
给定网格体积X, Y,Z上的数据,此示例绘制体积表面上的数据值。
axes3d.Axes3D.contourf该策略是使用适当的参数zdir和offset从每个表面中选择数据并分别绘制轮廓。

import matplotlib.pyplot as plt
import numpy as np

# Define dimensions
Nx, Ny, Nz = 100, 300, 500
X, Y, Z = np.meshgrid(np.arange(Nx), np.arange(Ny), -np.arange(Nz))

# Create fake data
data = (((X+100)**2 + (Y-20)**2 + 2*Z)/1000+1)

kw = {
    'vmin': data.min(),
    'vmax': data.max(),
    'levels': np.linspace(data.min(), data.max(), 10),
}

# Create a figure with 3D ax
fig = plt.figure(figsize=(5, 4))
ax = fig.add_subplot(111, projection='3d')

# Plot contour surfaces
_ = ax.contourf(
    X[:, :, 0], Y[:, :, 0], data[:, :, 0],
    zdir='z', offset=0, **kw
)
_ = ax.contourf(
    X[0, :, :], data[0, :, :], Z[0, :, :],
    zdir='y', offset=0, **kw
)
C = ax.contourf(
    data[:, -1, :], Y[:, -1, :], Z[:, -1, :],
    zdir='x', offset=X.max(), **kw
)
# --


# Set limits of the plot from coord limits
xmin, xmax = X.min(), X.max()
ymin, ymax = Y.min(), Y.max()
zmin, zmax = Z.min(), Z.max()
ax.set(xlim=[xmin, xmax], ylim=[ymin, ymax], zlim=[zmin, zmax])

# Plot edges
edges_kw = dict(color='0.4', linewidth=1, zorder=1e3)
ax.plot([xmax, xmax], [ymin, ymax], 0, **edges_kw)
ax.plot([xmin, xmax], [ymin, ymin], 0, **edges_kw)
ax.plot([xmax, xmax], [ymin, ymin], [zmin, zmax], **edges_kw)

# Set labels and zticks
ax.set(
    xlabel='X [km]',
    ylabel='Y [km]',
    zlabel='Z [m]',
    zticks=[0, -150, -300, -450],
)

# Set zoom and angle view
ax.view_init(40, -30, 0)
ax.set_box_aspect(None, zoom=0.9)

# Colorbar
fig.colorbar(C, ax=ax, fraction=0.02, pad=0.1, label='Name [units]')

# Show Figure
plt.show()
脚本总运行时间:(0分1.535秒)