笔记
单击此处 下载完整的示例代码
简单图例01 #
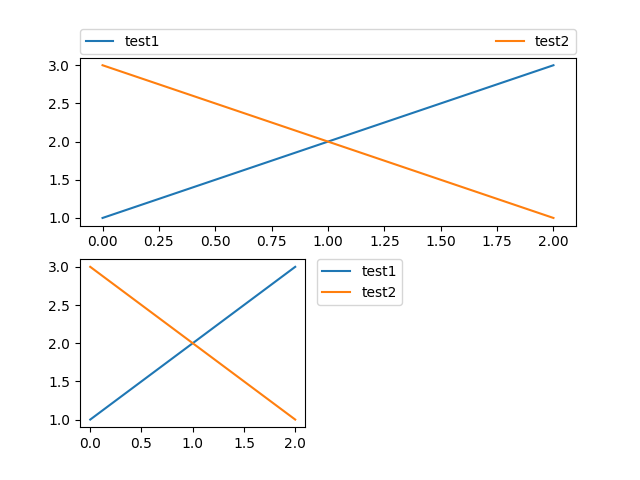
import matplotlib.pyplot as plt


fig = plt.figure()

ax = fig.add_subplot(211)
ax.plot([1, 2, 3], label="test1")
ax.plot([3, 2, 1], label="test2")
# Place a legend above this subplot, expanding itself to
# fully use the given bounding box.
ax.legend(bbox_to_anchor=(0., 1.02, 1., .102), loc='lower left',
           ncol=2, mode="expand", borderaxespad=0.)

ax = fig.add_subplot(223)
ax.plot([1, 2, 3], label="test1")
ax.plot([3, 2, 1], label="test2")
# Place a legend to the right of this smaller subplot.
ax.legend(bbox_to_anchor=(1.05, 1), loc='upper left', borderaxespad=0.)

plt.show()