笔记
单击此处 下载完整的示例代码
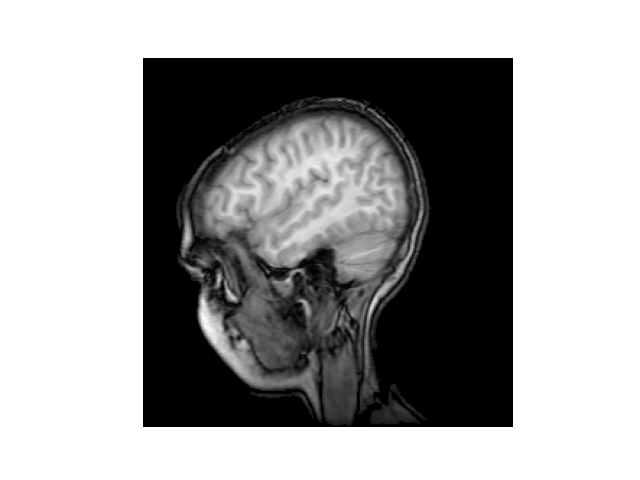
核磁共振#
此示例说明如何将(MRI)图像读取到 NumPy 数组中,并使用imshow.
import matplotlib.pyplot as plt
import matplotlib.cbook as cbook
import numpy as np


# Data are 256x256 16 bit integers.
with cbook.get_sample_data('s1045.ima.gz') as dfile:
    im = np.frombuffer(dfile.read(), np.uint16).reshape((256, 256))

fig, ax = plt.subplots(num="MRI_demo")
ax.imshow(im, cmap="gray")
ax.axis('off')

plt.show()