笔记
单击此处 下载完整的示例代码
锚定艺术家#
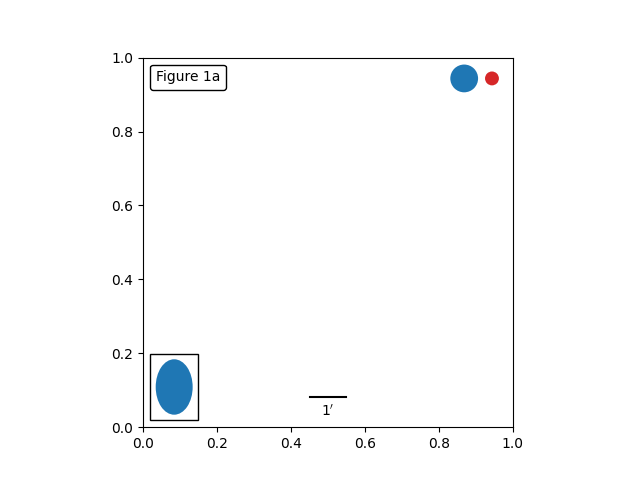
这个例子说明了锚定对象的使用,而没有在mpl_toolkits.axes_grid1. 此版本的图类似于
Simple Anchored Artists中的版本,但它仅使用 matplotlib 命名空间实现,无需其他工具包的帮助。

from matplotlib import pyplot as plt
from matplotlib.lines import Line2D
from matplotlib.patches import Circle, Ellipse
from matplotlib.offsetbox import (
    AnchoredOffsetbox, AuxTransformBox, DrawingArea, TextArea, VPacker)


def draw_text(ax):
    """Draw a text-box anchored to the upper-left corner of the figure."""
    box = AnchoredOffsetbox(child=TextArea("Figure 1a"),
                            loc="upper left", frameon=True)
    box.patch.set_boxstyle("round,pad=0.,rounding_size=0.2")
    ax.add_artist(box)


def draw_circles(ax):
    """Draw circles in axes coordinates."""
    area = DrawingArea(40, 20, 0, 0)
    area.add_artist(Circle((10, 10), 10, fc="tab:blue"))
    area.add_artist(Circle((30, 10), 5, fc="tab:red"))
    box = AnchoredOffsetbox(
        child=area, loc="upper right", pad=0, frameon=False)
    ax.add_artist(box)


def draw_ellipse(ax):
    """Draw an ellipse of width=0.1, height=0.15 in data coordinates."""
    aux_tr_box = AuxTransformBox(ax.transData)
    aux_tr_box.add_artist(Ellipse((0, 0), width=0.1, height=0.15))
    box = AnchoredOffsetbox(child=aux_tr_box, loc="lower left", frameon=True)
    ax.add_artist(box)


class AnchoredSizeBar(AnchoredOffsetbox):
    def __init__(self, transform, size, label, loc,
                 pad=0.1, borderpad=0.1, sep=2, prop=None, frameon=True):
        """
        Draw a horizontal bar with the size in data coordinate of the given
        axes. A label will be drawn underneath (center-aligned).

        pad, borderpad in fraction of the legend font size (or prop)
        sep in points.
        """
        self.size_bar = AuxTransformBox(transform)
        self.size_bar.add_artist(Line2D([0, size], [0, 0], color="black"))
        self.txt_label = TextArea(label)
        self._box = VPacker(children=[self.size_bar, self.txt_label],
                            align="center",
                            pad=0, sep=sep)
        super().__init__(loc, pad=pad, borderpad=borderpad,
                         child=self._box, prop=prop, frameon=frameon)


def draw_sizebar(ax):
    """
    Draw a horizontal bar with length of 0.1 in data coordinates,
    with a fixed label underneath.
    """
    asb = AnchoredSizeBar(ax.transData,
                          0.1,
                          r"1$^{\prime}$",
                          loc='lower center',
                          pad=0.1, borderpad=0.5, sep=5,
                          frameon=False)
    ax.add_artist(asb)


fig, ax = plt.subplots()
ax.set_aspect(1)

draw_text(ax)
draw_circles(ax)
draw_ellipse(ax)
draw_sizebar(ax)

plt.show()