笔记
单击此处 下载完整的示例代码
自定义代码#
该matplotlib.ticker模块定义了许多预设代码,但主要是为可扩展性而设计的,即支持用户自定义的代码。
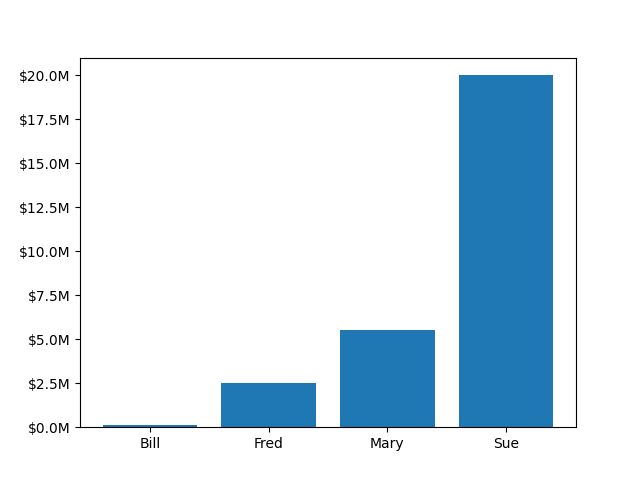
在此示例中,用户定义的函数用于在 y 轴上格式化以百万美元为单位的刻度。
import matplotlib.pyplot as plt


def millions(x, pos):
    """The two arguments are the value and tick position."""
    return '${:1.1f}M'.format(x*1e-6)


fig, ax = plt.subplots()
# set_major_formatter internally creates a FuncFormatter from the callable.
ax.yaxis.set_major_formatter(millions)
money = [1.5e5, 2.5e6, 5.5e6, 2.0e7]
ax.bar(['Bill', 'Fred', 'Mary', 'Sue'], money)
plt.show()