笔记
单击此处 下载完整的示例代码
秤#
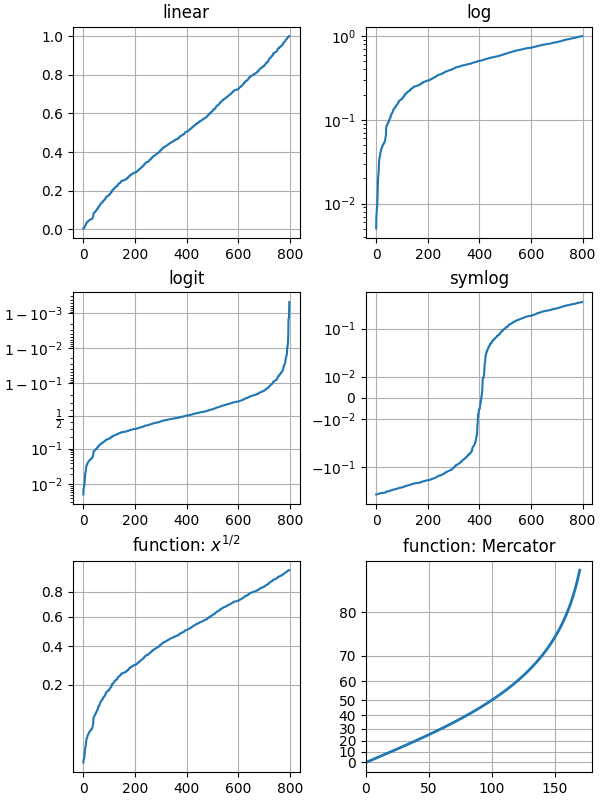
说明应用于轴的比例变换,例如 log、symlog、logit。
最后两个示例是'function'通过为比例变换提供正向和逆向函数来使用比例的示例。
import numpy as np
import matplotlib.pyplot as plt
from matplotlib.ticker import NullFormatter, FixedLocator

# Fixing random state for reproducibility
np.random.seed(19680801)

# make up some data in the interval ]0, 1[
y = np.random.normal(loc=0.5, scale=0.4, size=1000)
y = y[(y > 0) & (y < 1)]
y.sort()
x = np.arange(len(y))

# plot with various axes scales
fig, axs = plt.subplots(3, 2, figsize=(6, 8),
                        constrained_layout=True)

# linear
ax = axs[0, 0]
ax.plot(x, y)
ax.set_yscale('linear')
ax.set_title('linear')
ax.grid(True)


# log
ax = axs[0, 1]
ax.plot(x, y)
ax.set_yscale('log')
ax.set_title('log')
ax.grid(True)


# symmetric log
ax = axs[1, 1]
ax.plot(x, y - y.mean())
ax.set_yscale('symlog', linthresh=0.02)
ax.set_title('symlog')
ax.grid(True)

# logit
ax = axs[1, 0]
ax.plot(x, y)
ax.set_yscale('logit')
ax.set_title('logit')
ax.grid(True)


# Function x**(1/2)
def forward(x):
    return x**(1/2)


def inverse(x):
    return x**2


ax = axs[2, 0]
ax.plot(x, y)
ax.set_yscale('function', functions=(forward, inverse))
ax.set_title('function: $x^{1/2}$')
ax.grid(True)
ax.yaxis.set_major_locator(FixedLocator(np.arange(0, 1, 0.2)**2))
ax.yaxis.set_major_locator(FixedLocator(np.arange(0, 1, 0.2)))


# Function Mercator transform
def forward(a):
    a = np.deg2rad(a)
    return np.rad2deg(np.log(np.abs(np.tan(a) + 1.0 / np.cos(a))))


def inverse(a):
    a = np.deg2rad(a)
    return np.rad2deg(np.arctan(np.sinh(a)))

ax = axs[2, 1]

t = np.arange(0, 170.0, 0.1)
s = t / 2.

ax.plot(t, s, '-', lw=2)

ax.set_yscale('function', functions=(forward, inverse))
ax.set_title('function: Mercator')
ax.grid(True)
ax.set_xlim([0, 180])
ax.yaxis.set_minor_formatter(NullFormatter())
ax.yaxis.set_major_locator(FixedLocator(np.arange(0, 90, 10)))

plt.show()

参考
此示例中显示了以下函数、方法、类和模块的使用:
脚本总运行时间:(0分1.848秒)