笔记
单击此处 下载完整的示例代码
艺术家测试#
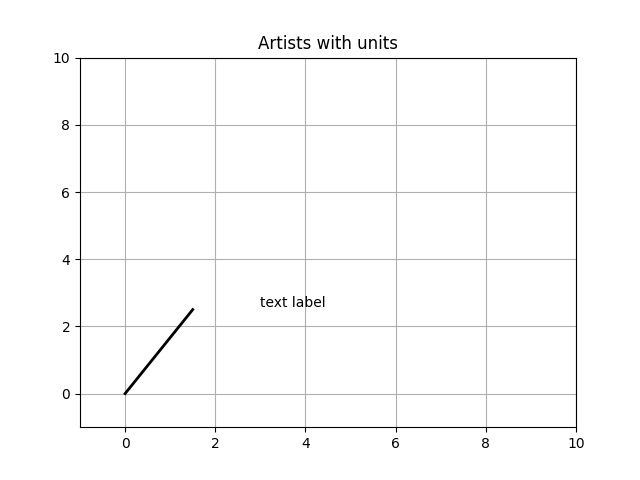
每个 Matplotlib 原始艺术家类型的测试单元支持。
轴处理单位转换,艺术家保留指向其轴父级的指针。如果要将艺术家与单位数据一起使用,则必须使用轴实例初始化艺术家,否则他们将不知道如何将单位转换为标量。
这个例子需要basic_units.py

import random
import matplotlib.lines as lines
import matplotlib.patches as patches
import matplotlib.text as text
import matplotlib.collections as collections

from basic_units import cm, inch
import numpy as np
import matplotlib.pyplot as plt

fig, ax = plt.subplots()
ax.xaxis.set_units(cm)
ax.yaxis.set_units(cm)

# Fixing random state for reproducibility
np.random.seed(19680801)

if 0:
    # test a line collection
    # Not supported at present.
    verts = []
    for i in range(10):
        # a random line segment in inches
        verts.append(zip(*inch*10*np.random.rand(2, random.randint(2, 15))))
    lc = collections.LineCollection(verts, axes=ax)
    ax.add_collection(lc)

# test a plain-ol-line
line = lines.Line2D([0*cm, 1.5*cm], [0*cm, 2.5*cm],
                    lw=2, color='black', axes=ax)
ax.add_line(line)

if 0:
    # test a patch
    # Not supported at present.
    rect = patches.Rectangle((1*cm, 1*cm), width=5*cm, height=2*cm,
                             alpha=0.2, axes=ax)
    ax.add_patch(rect)


t = text.Text(3*cm, 2.5*cm, 'text label', ha='left', va='bottom', axes=ax)
ax.add_artist(t)

ax.set_xlim(-1*cm, 10*cm)
ax.set_ylim(-1*cm, 10*cm)
# ax.xaxis.set_units(inch)
ax.grid(True)
ax.set_title("Artists with units")
plt.show()