笔记
单击此处 下载完整的示例代码
轮廓演示#
如何使用该axes.Axes.contourf方法创建填充等高线图。
import numpy as np
import matplotlib.pyplot as plt

origin = 'lower'

delta = 0.025

x = y = np.arange(-3.0, 3.01, delta)
X, Y = np.meshgrid(x, y)
Z1 = np.exp(-X**2 - Y**2)
Z2 = np.exp(-(X - 1)**2 - (Y - 1)**2)
Z = (Z1 - Z2) * 2

nr, nc = Z.shape

# put NaNs in one corner:
Z[-nr // 6:, -nc // 6:] = np.nan
# contourf will convert these to masked


Z = np.ma.array(Z)
# mask another corner:
Z[:nr // 6, :nc // 6] = np.ma.masked

# mask a circle in the middle:
interior = np.sqrt(X**2 + Y**2) < 0.5
Z[interior] = np.ma.masked
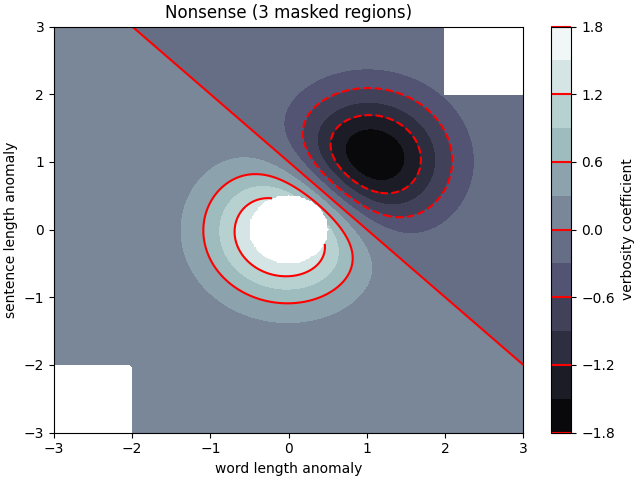
自动轮廓级别#
我们正在使用轮廓级别的自动选择;这通常不是一个好主意,因为它们不会出现在好的边界上,但我们在这里这样做是为了说明。
fig1, ax2 = plt.subplots(constrained_layout=True)
CS = ax2.contourf(X, Y, Z, 10, cmap=plt.cm.bone, origin=origin)

# Note that in the following, we explicitly pass in a subset of the contour
# levels used for the filled contours.  Alternatively, we could pass in
# additional levels to provide extra resolution, or leave out the *levels*
# keyword argument to use all of the original levels.

CS2 = ax2.contour(CS, levels=CS.levels[::2], colors='r', origin=origin)

ax2.set_title('Nonsense (3 masked regions)')
ax2.set_xlabel('word length anomaly')
ax2.set_ylabel('sentence length anomaly')

# Make a colorbar for the ContourSet returned by the contourf call.
cbar = fig1.colorbar(CS)
cbar.ax.set_ylabel('verbosity coefficient')
# Add the contour line levels to the colorbar
cbar.add_lines(CS2)

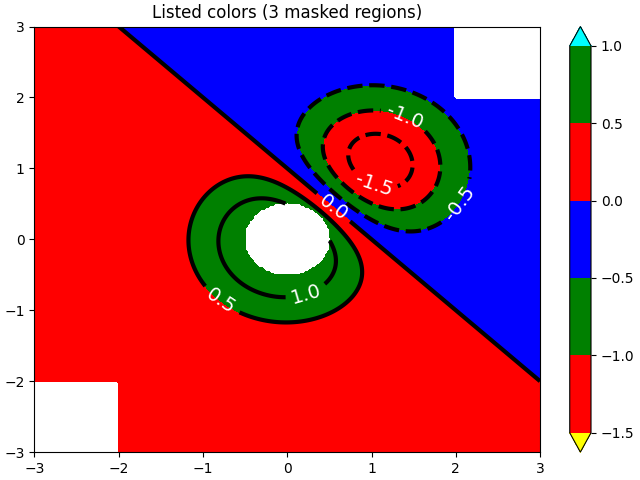
显式轮廓级别#
现在使用指定的级别制作等高线图,并使用从颜色列表自动生成的颜色图。
fig2, ax2 = plt.subplots(constrained_layout=True)
levels = [-1.5, -1, -0.5, 0, 0.5, 1]
CS3 = ax2.contourf(X, Y, Z, levels,
                   colors=('r', 'g', 'b'),
                   origin=origin,
                   extend='both')
# Our data range extends outside the range of levels; make
# data below the lowest contour level yellow, and above the
# highest level cyan:
CS3.cmap.set_under('yellow')
CS3.cmap.set_over('cyan')

CS4 = ax2.contour(X, Y, Z, levels,
                  colors=('k',),
                  linewidths=(3,),
                  origin=origin)
ax2.set_title('Listed colors (3 masked regions)')
ax2.clabel(CS4, fmt='%2.1f', colors='w', fontsize=14)

# Notice that the colorbar gets all the information it
# needs from the ContourSet object, CS3.
fig2.colorbar(CS3)

<matplotlib.colorbar.Colorbar object at 0x7f2d00f39ae0>
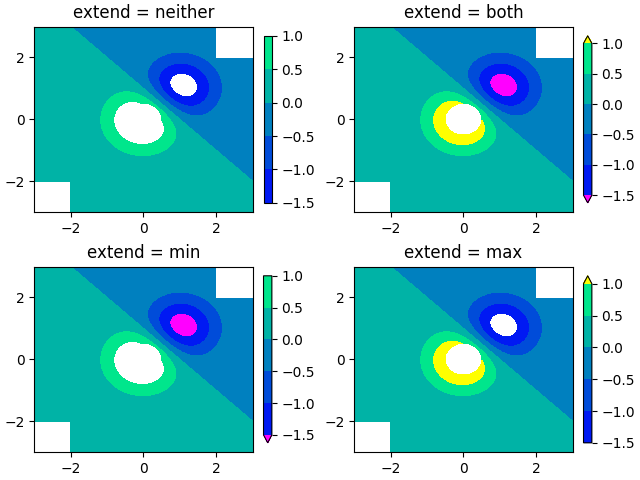
扩展设置#
说明所有 4 种可能的“扩展”设置:
extends = ["neither", "both", "min", "max"]
cmap = plt.colormaps["winter"].with_extremes(under="magenta", over="yellow")
# Note: contouring simply excludes masked or nan regions, so
# instead of using the "bad" colormap value for them, it draws
# nothing at all in them.  Therefore the following would have
# no effect:
# cmap.set_bad("red")

fig, axs = plt.subplots(2, 2, constrained_layout=True)

for ax, extend in zip(axs.flat, extends):
    cs = ax.contourf(X, Y, Z, levels, cmap=cmap, extend=extend, origin=origin)
    fig.colorbar(cs, ax=ax, shrink=0.9)
    ax.set_title("extend = %s" % extend)
    ax.locator_params(nbins=4)

plt.show()

脚本总运行时间:(0分2.512秒)